
You’ve built a solid .NET API. It passes all your tests, your code is clean, and everything looks great on your machine. Then it hits production — and suddenly response times are creeping up, your team starts noticing, and you’re left staring at the dashboard wondering what went wrong.
Here’s the uncomfortable truth: most .NET API performance problems aren’t caused by one dramatic bug. They’re a slow accumulation of small, easy-to-miss mistakes that compound under real load.
The good news? Once you know where to look, most of these are surprisingly fast to fix.
Let’s walk through the six most common reasons .NET APIs slow down — and exactly what to do about each one.
Fix #1: You’re Not Using async/await Properly
This one sounds obvious, but it’s shockingly common — even among experienced developers.
When you block a thread (.Result, .Wait(), GetAwaiter().GetResult()) instead of properly awaiting an async operation, you’re tying up a thread pool thread that could be serving other requests. Under load, this causes thread starvation — your app stops accepting new requests, not because the CPU is maxed out, but because all threads are stuck waiting.
What it looks like (the bad version):
❌ Blocking — don’t do this
public IActionResult GetUser(int id)
{
  var user = _userService.GetUserAsync(id).Result; // BLOCKS thread
  return Ok(user);
}
What it should look like:
✅ Properly async
public async Task<IActionResult> GetUser(int id)
{
    var user = await _userService.GetUserAsync(id);
    return Ok(user);
}
💡 Quick Win: Search your codebase for .Result and .Wait() — those are your red flags. Replace them with proper await patterns and you may see immediate improvements under load.
Fix #2: N+1 Queries Are Killing Your Database
If your API talks to a database, N+1 queries are probably your biggest performance killer — and they’re notoriously easy to accidentally introduce with ORMs like Entity Framework.
The classic scenario: you fetch a list of 100 orders, and then for each order, your code quietly fires off another query to get the customer name. That’s 101 database round trips instead of 1.
The N+1 problem in action:
❌ This fires one query per order — classic N+1
var orders = await _context.Orders.ToListAsync();

foreach (var order in orders)
{
    var customer = await _context.Customers
    .FindAsync(order.CustomerId); // 💥 N queries
}
The fix — eager loading with Include:
✅ One query, all the data you need
var orders = await _context.Orders
.Include(o => o.Customer)
.ToListAsync();
💡 Pro Tip: Enable EF Core query logging in development. Seeing 47 queries fire for a single API call is a sobering wake-up call — and a fast way to find your N+1 problems.
Fix #3: You’re Fetching Way More Data Than You Need
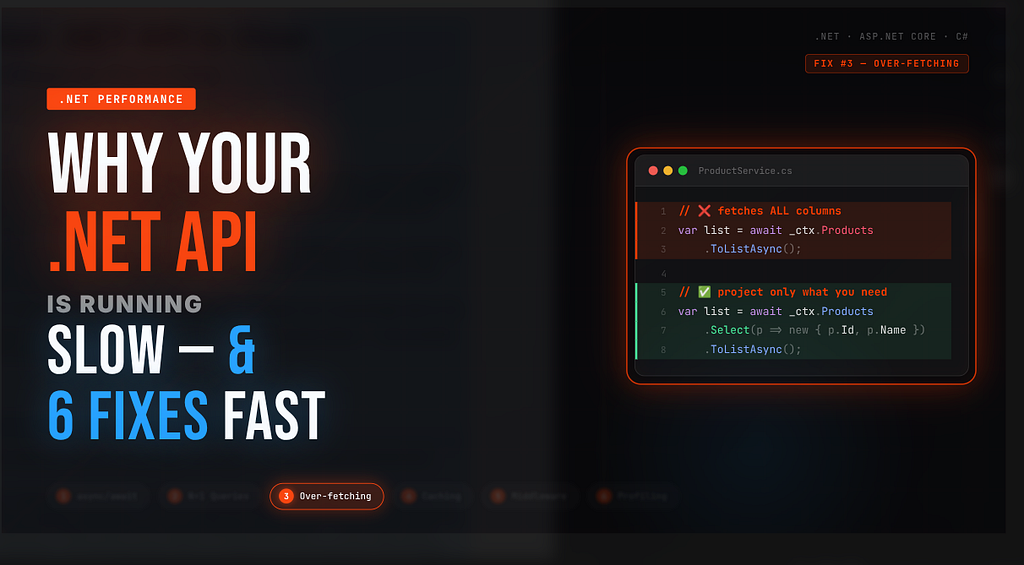
Another sneaky EF Core habit: selecting entire entities when you only need a couple of fields. Pulling 30 columns across 500 rows when you only need 3 of them wastes database bandwidth, serialization time, and memory.
Over-fetching the whole entity:
❌ Fetches ALL columns for every product
var products = await _context.Products.ToListAsync();
Use projections — fetch only what you need:
✅ Only fetches what the API actually returns
var products = await _context.Products
.Select(p => new ProductSummaryDto
{
    Id = p.Id,
    Name = p.Name,
    Price = p.Price
})
.ToListAsync();
This pattern also pairs naturally with pagination. Returning 5,000 records when your UI only shows 20 at a time is a classic mistake that’s dead easy to fix.
⚡ Add This: Use .Skip() and .Take() for pagination, and consider adding AsNoTracking() for read-only queries — EF Core won’t bother tracking changes for objects it doesn’t need to update.
Fix #4: You Have Zero Caching Strategy
If your API hits the database every single time for data that barely changes — configuration values, product catalogues, lookup tables — you’re throwing performance away.
Caching is one of the highest-leverage optimizations you can make. Even a 30-second cache on a frequently-hit endpoint can dramatically reduce database load.
In-memory caching for lightweight needs:
// Register in Program.cs
builder.Services.AddMemoryCache();
// Use in your service
public async Task<IEnumerable<Category>> GetCategoriesAsync()
{
  return await _cache.GetOrCreateAsync("categories", async entry =>
  {
    entry.AbsoluteExpirationRelativeToNow = TimeSpan.FromMinutes(10);
    return await _context.Categories.ToListAsync();
  });
}
For distributed scenarios (multiple API instances), swap IMemoryCache for IDistributedCache backed by Redis. The pattern is almost identical.
🎯 Where to start: Look at your most frequently called endpoints — the ones that show up in every user session. Those are your best caching candidates. Even a short TTL makes a massive difference.
Fix #5: Your Middleware Pipeline Is Doing Too Much
Every request in ASP.NET Core flows through your middleware pipeline. If you’ve piled on middleware without thinking about order or necessity, you’re adding latency to every single request.
Common culprits:
- Running UseStaticFiles() when your API doesn’t serve static files
- Heavy logging middleware firing on every request, including health checks
- Authentication middleware running before routing — meaning it runs even for unauthenticated public endpoints
- CORS middleware misconfigured to do unnecessary preflight work
Think carefully about middleware order:
✅ Ordered for performance
app.UseRouting(); // Resolve route first
app.UseAuthentication(); // Then auth - only for matched routes
app.UseAuthorization();
app.MapControllers();
🔍 Audit This: Remove middleware you’re not using. Add conditional logging that skips health check endpoints. Small changes here compound across every request your API handles.
Fix #6: You’re Not Measuring — So You’re Guessing
This is the fix that unlocks all the others: if you’re not measuring, you’re just guessing about where your performance problems actually are.
Every .NET developer should have these tools in their workflow:
BenchmarkDotNet — for micro-benchmarks
[MemoryDiagnoser]
public class MyBenchmarks
{
  [Benchmark]
  public string WithStringBuilder() { /* … */ }
  [Benchmark]
  public string WithStringConcat() { /* … */ }
}
dotnet-trace — for production profiling
dotnet trace collect — process-id <PID> — providers Microsoft-DotNETCore-SampleProfiler
MiniProfiler — for request-level insights
builder.Services.AddMiniProfiler(options =>
{
    options.RouteBasePath = "/profiler";
}).AddEntityFramework();
MiniProfiler is especially useful in development — it overlays query counts and timing information directly on your API responses, making N+1 problems impossible to miss.
📊 Rule of thumb: Never optimize without a baseline measurement. Benchmark before and after every change. Otherwise you might spend hours on something that had no real impact.
Wrapping Up
Performance problems in .NET APIs rarely announce themselves. They creep in gradually — one blocking call here, one missing Include there — until one day your response times are embarrassing and you’re not sure where to start.
The six fixes above cover the vast majority of real-world .NET API slowdowns:
- Use async/await properly — never block threads
- Eliminate N+1 queries with eager loading
- Fetch only the data you actually need
- Cache data that doesn’t change frequently
- Keep your middleware pipeline lean and ordered
- Measure first, optimize second — always
You don’t need to implement all of these at once. Pick the one that resonates most with what you’re seeing in your app, measure the impact, and go from there. Small, targeted improvements compound into big wins.
Have a performance tip that saved your .NET API? Drop it in the comments — I’d love to hear what worked for you.